This is the full developer documentation for mycroblog
# Overview of a mycroblog server
> The first page to read before running a server. mycroblog is a microblog that federates with the rest of the fediverse over ActivityPub; my is its server software, one binary that holds the server…
The first page to read before running a server. mycroblog is a microblog that federates with the rest of the fediverse over ActivityPub; `my` is its server software, one binary that holds the server, the job worker, the web client, and the commands that look after them. This page shows what a server is made of, what you choose by configuration, how a small server grows into a large one, and where to read next.
## What a server is made of
[Section titled “What a server is made of”](#what-a-server-is-made-of)
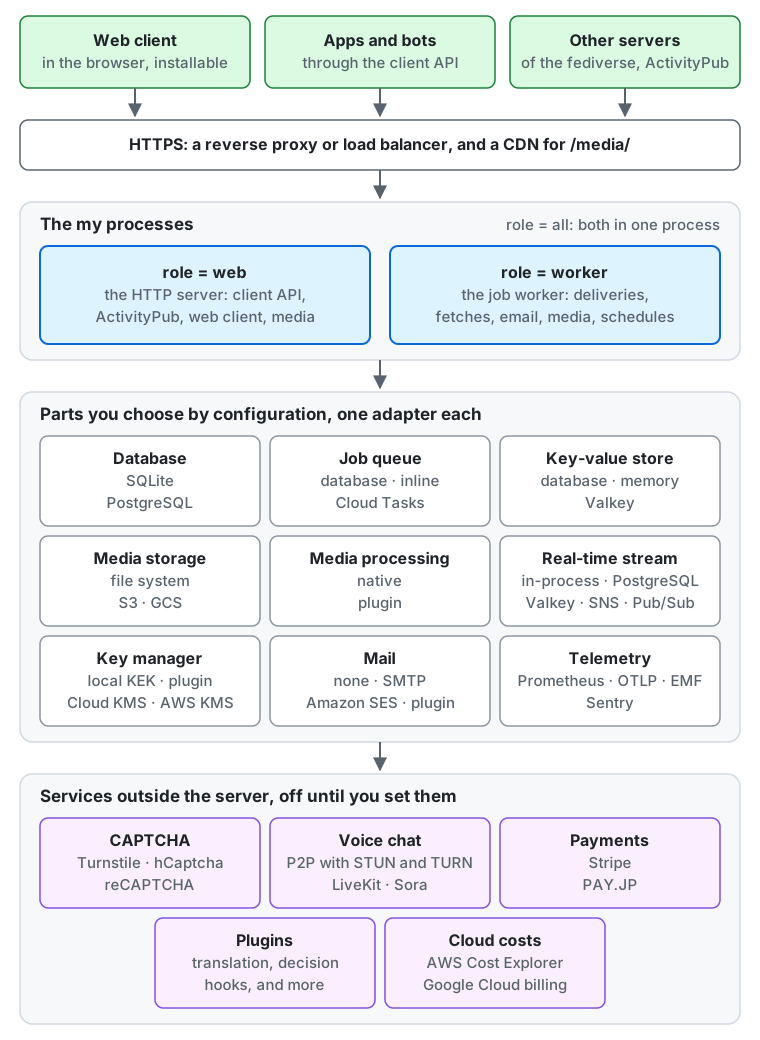
From the top of the diagram down:
* **Who connects.** People use the web client in their browser (it can be installed as an app), apps and bots use the client API, and other fediverse servers deliver and fetch posts over ActivityPub. All of them reach the server over HTTPS.
* **In front of the server.** By default `my` speaks plain HTTP, so a reverse proxy or load balancer terminates HTTPS in front of it. On a single machine, `my` can serve HTTPS itself instead ([serving HTTPS from the server](/next/operations/running/#serving-https-from-the-server)). A CDN in front of the media files is optional.
* **The `my` processes.** Each process runs `my serve`, and its [`role`](/next/reference/configuration/#role) says what it runs: `web` the HTTP server, `worker` the job worker, which delivers posts, fetches from other servers, sends email, processes media, and runs the periodic jobs, and `all`, the default, both in one process.
* **The parts you choose.** Each part in the middle of the diagram has one setting that picks its adapter, listed in [the next section](#parts-you-choose-by-configuration).
* **Services outside the server.** CAPTCHA, voice chat, payments, plugins, and the import of cloud costs each stay off until you set them, and the server then calls the service you name.
## Parts you choose by configuration
[Section titled “Parts you choose by configuration”](#parts-you-choose-by-configuration)
Every part is a setting of the [configuration reference](/next/reference/configuration/), set in a TOML file or as an environment variable (`MY_` and the key in capitals, such as `MY_DATABASE`). The first option of each list is the default. Where a part keeps data, choose it before the first start: the data does not move by itself when the setting changes.
| Part | Setting | Options | Read next |
| --------------------------------------------------------------------------------------------- | ---------------------------------------------------------------------------------------------------------------------------------------------------------------------------------------------------------------- | ----------------------------------------------------------------------------------------------------------------------------------------------------------------------------------------------------------------------------------------------------------------------------------------------- | -------------------------------------------------------------------------------------------------------------------------------------- |
| Database | [`database`](/next/reference/configuration/#database) | `sqlite` (a file), `postgres` (PostgreSQL and compatible services) | [Database](/next/operations/database/), [backup](/next/operations/backup/) |
| Job queue | [`queue`](/next/reference/configuration/#queue) | `db` (a table in the database), `inline` (runs each job at once in the same process, for tests and development), `cloudtasks` (Google Cloud Tasks wakes the server for each job; needs PostgreSQL) | [The job queue](/next/operations/running/#the-job-queue-and-failed-dead-jobs) |
| Key-value store, for caches, rate limits, and the answers kept for a day to writes sent again | [`kv`](/next/reference/configuration/#kv) | `db` (a table in the database), `memory` (each process on its own), `valkey` (Valkey or another Redis-protocol server, shared by every process) | [`kv`](/next/reference/configuration/#kv) |
| Media storage | [`blob`](/next/reference/configuration/#blob) | `fs` (a directory), `s3` (Amazon S3, Cloudflare R2, MinIO, Garage, and other S3-compatible stores), `gcs` (Google Cloud Storage) | [Docker Compose files](/next/operations/running/#docker-compose-files), [backing up media](/next/operations/backup/#media-in-a-bucket) |
| Media processing | [`media_image`](/next/reference/configuration/#media_image), [`media_video`](/next/reference/configuration/#media_video), [`media_audio`](/next/reference/configuration/#media_audio), one for each kind of file | `native` (in the server), `plugin` (a plugin of yours converts the files of that kind) | [Converting media](/next/operations/plugins/#converting-media) |
| Real-time stream between processes | [`stream`](/next/reference/configuration/#stream) | `hub` (inside one process), `postgres` (`LISTEN` / `NOTIFY`), `valkey`, `sns` (Amazon SNS and SQS), `pubsub` (Google Cloud Pub/Sub) | [`stream`](/next/reference/configuration/#stream) |
| Key manager, which encrypts the accounts’ private keys | [`key_manager`](/next/reference/configuration/#key_manager) | `local` (a key-encryption key you keep), `gcpkms` (Google Cloud KMS), `awskms` (AWS KMS), `plugin` | [Managing the key](/next/operations/key-management/) |
| Email | [`mail`](/next/reference/configuration/#mail) | `none`, `smtp`, `ses` (Amazon SES), `plugin` | [Sending email](/next/operations/email/) |
| CAPTCHA | [`captcha`](/next/reference/configuration/#captcha) | `none`, `turnstile` (Cloudflare Turnstile), `hcaptcha`, `recaptcha` (Google reCAPTCHA v2) | [CAPTCHA](/next/operations/captcha/) |
| Voice chat | [`voice`](/next/reference/configuration/#voice) | `off`, `p2p` (browser to browser, with TURN from `voice_turn`: `none`, `coturn`, or `cloudflare`), `livekit`, `sora` | [Voice chat](/next/operations/voice/) |
| Supporter payments | [`payments`](/next/reference/configuration/#payments) | `none`, `stripe`, `payjp` (PAY.JP) | [Supporters](/next/operations/supporters/), [Stripe](/next/operations/payments-stripe/), [PAY.JP](/next/operations/payments-payjp/) |
| Plugins | `plugin__address` | none by default; one address for each kind: `translator`, `search`, `billing`, `mailer`, `media_image`, `media_video`, `media_audio`, `key_manager`, and the decision hooks `inbound.status`, `local.status`, `inbound.follow`, `signup.check`, `media.check`, `inbound.actor`, `local.profile` | [Plugins](/next/operations/plugins/), [decision hooks](/next/operations/decision-hooks/) |
| Translation of posts | `translator__*`, [`plugin_translator_address`](/next/reference/configuration/#plugin_translator_address) | none (only the browser’s own translation); `libretranslate`, `deepl`, `google` (Google Cloud Translation), `aws` (Amazon Translate), or a plugin of yours in front of the service you choose | [Translating posts](/next/operations/translation/), [a translator plugin](/next/operations/plugins/#translating-posts) |
| Full-text search of posts | [`search`](/next/reference/configuration/#search) | `none`; or `elasticsearch`, `opensearch`, or `meilisearch` ([search engines](/next/operations/search-engines/)); or `plugin`, a plugin of yours in front of another engine | [Full-text search](/next/operations/search/), [a search plugin](/next/operations/plugins/#searching-posts) |
| CDN for media | [`media_origin`](/next/reference/configuration/#media_origin) | unset (the server serves media from its own origin), or the origin of your CDN | [Serving media through a CDN](/next/operations/cdn/) |
| Cloud costs | [`billing_sources`](/next/reference/configuration/#billing_sources) | none, or any of `aws` (AWS Cost Explorer), `gcp` (Google Cloud’s billing export or budget), `cloudflare` (Cloudflare’s usage charges), `plugin` | [Importing cloud costs](/next/operations/billing-import/) |
| Metrics | [`metrics_exporter`](/next/reference/configuration/#metrics_exporter) | `none`, `prometheus`, `otlp` (OpenTelemetry), `emf` (CloudWatch) | [Metrics](/next/operations/running/#metrics), [alerts](/next/operations/alerts/) |
| Traces | [`traces_exporter`](/next/reference/configuration/#traces_exporter) | `none`, `otlp` | [Traces](/next/operations/running/#traces) |
| Error reports | [`errors_exporter`](/next/reference/configuration/#errors_exporter) | `none` (the log line and the error groups only), `sentry` (Sentry, GlitchTip, Datadog), `otlp` | [Error reporting](/next/operations/error-reporting/) |
The released binary and container image hold every adapter of the table.
`my config check` reports every problem of the configuration at once, before you start the server ([production checklist](/next/operations/production-checklist/)).
## From a small server to a large one
[Section titled “From a small server to a large one”](#from-a-small-server-to-a-large-one)
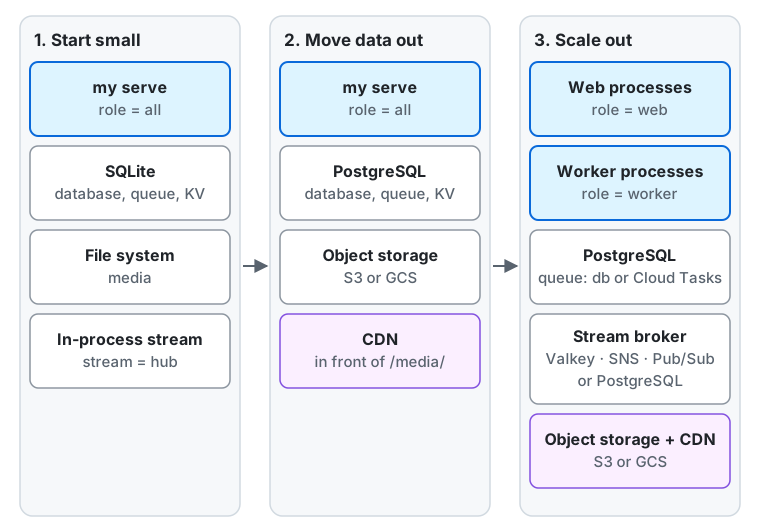
1. **Start small.** One process with `role = all`, on SQLite, with media on the file system and the defaults for the rest: the queue and the key-value store in the database, and the real-time stream inside the process. The Docker Compose files in `deploy/docker` start this setup on one machine ([deploying with Docker Compose](/next/operations/deploy-docker-compose/)). It suits a personal or small server. `stream = hub` reaches only the process it runs in, so this setup stays at one process.
2. **Move the data out.** PostgreSQL for the database, an S3-compatible bucket or Google Cloud Storage for the media, and a CDN in front of the media. The server is still one process, but it no longer depends on one disk, and the processes of the next step can share the data. Decide on this before the first start if you can: moving the data from SQLite and the file system later is a job of its own ([what to back up](/next/operations/backup/#what-to-back-up) lists what has to move).
3. **Scale out.** Run processes with `role = web` for the requests and `role = worker` for the jobs, as many as each needs, and split the workers by job type ([splitting workers](/next/operations/running/#splitting-workers-by-job-type)). With more than one process, the real-time stream needs a broker that reaches every process (`postgres`, `valkey`, `sns`, or `pubsub`), and the key-value store should be shared (`db` or `valkey`), since `memory` keeps the rate limits and the answers to writes sent again of each process apart. The job queue stays in PostgreSQL, or moves to Google Cloud Tasks ([Cloud Tasks](/next/operations/running/#cloud-tasks)).
The [Cloud Run deployment](/next/operations/deploy-cloud-run/) is an example of a setup between the second and the third step: `role = all` on Cloud Run, PostgreSQL on Neon, media in Cloud Storage, Cloud Tasks for the jobs, and Pub/Sub for the stream, with no instance running while nobody uses the server.
## Where to go next
[Section titled “Where to go next”](#where-to-go-next)
Read the operator guides in this order:
1. **Get started:** [run the server](/next/operations/running/) or [deploy it on Cloud Run](/next/operations/deploy-cloud-run/), then go through the [production checklist](/next/operations/production-checklist/) before you open it to users.
2. **Configure the instance:** its [settings](/next/operations/instance-settings/), [registration](/next/operations/registration/), [external login providers](/next/operations/login-providers/), [email](/next/operations/email/), [CAPTCHA](/next/operations/captcha/), [the CDN](/next/operations/cdn/), [link previews](/next/operations/link-previews/), and [search engines and AI crawlers](/next/operations/crawlers/).
3. **Turn on features:** [moderation](/next/operations/moderation/), [relays](/next/operations/relays/), [webhooks](/next/operations/webhooks/), [plugins](/next/operations/plugins/) and [decision hooks](/next/operations/decision-hooks/), [voice chat](/next/operations/voice/), [full-text search](/next/operations/search/), [supporters](/next/operations/supporters/) and their payments, and [importing cloud costs](/next/operations/billing-import/).
4. **Run it day to day:** [monitoring](/next/operations/monitoring/), [alerts](/next/operations/alerts/), [error reporting](/next/operations/error-reporting/), [maintenance](/next/operations/maintenance/), [backup](/next/operations/backup/), [the database](/next/operations/database/), [the key-encryption key](/next/operations/key-management/), and [administrators and roles](/next/operations/admin-cli/).
5. **Legal and closing:** the [privacy policy](/next/operations/privacy-policy-template/) and [record of processing](/next/operations/processing-record-template/) templates, and [closing the service](/next/operations/service-closure/).
The [configuration reference](/next/reference/configuration/) lists every setting, and the [jobs reference](/next/reference/jobs/) every job the workers run.
# Running the server: start, stop and health checks
> How to start and stop the server, get its image, and watch it while it runs: metrics, traces, the job queue, and health checks.
How to start and stop the server, get its image, and watch it while it runs: metrics, traces, the job queue, and health checks.
## Start the server
[Section titled “Start the server”](#start-the-server)
```sh
my config check # report every configuration problem at once
my config check -instance # also warn about instance settings that are not set (opens the database)
my serve # start according to the configured role (-config reads a TOML file)
my version # print the version of the binary
```
`my serve` validates the configuration, builds the database, job queue and key-management adapters, and accepts HTTP on `listen`. With `tls = off`, the default, it speaks plain HTTP/1.1 there: put a reverse proxy or load balancer in front that terminates HTTPS (and HTTP/2 or HTTP/3 for the clients) and forwards over HTTP/1.1. To serve HTTPS without a proxy, see [Serving HTTPS from the server](#serving-https-from-the-server). The real-time updates (`GET /api/v1/streaming`, the streams of the local and federated timelines, and the voice chat room streams) are long-lived responses that send a heartbeat comment every 30 seconds (15 for a voice room) and stay open while idle. The proxy must not buffer these responses (nginx: the server sends `X-Accel-Buffering: no`), and its idle or read timeout must be longer than the heartbeat interval. It does not apply the schema or run the data upgrade steps: run `my schema apply` and then `my db upgrade` before starting (see [Database](/next/operations/database/); upgrades run both as part of [Upgrading](/next/operations/database/#upgrading)). Until `my db upgrade` has recorded every step of the release, `/readyz` answers `503`. In the Docker Compose setup (`deploy/docker/compose.yaml`; see [Deploying with Docker Compose](/next/operations/deploy-docker-compose/)), the one-shot `schema` and `upgrade` services run `my schema apply` and `my db upgrade` before the server starts. If the schema is not applied, the process still starts and readiness returns 503, and it serves nothing else until the schema is there.
The first `my serve` or `my` command that uses the database records `host` and `account_domain` in it. When the configuration differs from the recorded values, `my serve` logs `start failed` with both pairs of values and exits with code 1, and the commands print the same error. The exceptions are `my schema apply` and `my db backup`, which do not check, and the maintenance mode, which does not read the database. `my config check -instance` and `my db upgrade -check` check but record nothing. A process that could not read the database when it started is not ready until it can, and until then it runs no jobs and answers `503` with `Retry-After` to every request except the health checks (`/healthz`, `/readyz`, `/health/live`, `/health/ready`, `/api/v1/instance/health`). This is also what a server started before `my schema apply` does. If it then finds different values, it stops with the same error.
In the `production` profile, `my config check` also checks that the valid settings suit a production instance: errors, such as a `host` that other servers cannot reach or a KEK that is not random, make it exit 1, and warnings, such as `mail = none`, do not. `my serve` logs both as warnings when it starts but starts anyway, so run `my config check` as a step of the deployment. The [production checklist](/next/operations/production-checklist/) lists the checks and what to verify by hand before going live.
| `role` | HTTP | Job worker |
| --------------- | ---------------------------------------- | ------------ |
| `all` (default) | All routes | Runs |
| `web` | All routes | Does not run |
| `worker` | Health checks only (for platform probes) | Runs |
Logs go to standard error as JSON Lines. Every line has `level` (`DEBUG`, `INFO`, `WARN`, `ERROR`) and `severity`, the same level in the form Cloud Logging reads (`DEBUG`, `INFO`, `WARNING`, `ERROR`, and `CRITICAL` for an error that stops the process). Logs written while handling a request carry a `request_id`, and the same ID is returned in the `X-Request-Id` response header. If the request’s `X-Request-Id` is at most 128 characters of letters, digits and `-_.:`, it is used as is, as the ID assigned by a load balancer. Logs inside a trace (requests and jobs) also carry `trace_id` and `span_id` (see [Traces](#traces)).
Each HTTP request and each job execution writes one line when it finishes. The line has the same names and values as the labels of the [metrics](#metrics) below, so on Cloud Run with `metrics_exporter = none` you can build Cloud Logging log-based metrics (counters and distributions) from these lines.
| Line (`msg`) | Fields |
| ------------------------------------------------------------------------------------- | ------------------------------------------------------------------------------------------------------------------------------------------------------------------------------------------------------------------------------------------------------------------------------------------------------------------------------------------------------------------------------------------------------------------------------------------------------------------------------------------------------------------------------------------------------------------------------------------------------------------------------------------------------------------------------------- |
| `http request` (`INFO`; health checks use `DEBUG`) | `http.request.method`, `http.route`, `my.surface` and `http.response.status_code` (a number) have the same values as the labels of `http.server.request.duration`. Also `duration_seconds` (a number of seconds), `url.path` (the path without the query string), `http.response.body.size` and `request_id`. `http.route` and `my.surface` are absent for requests that did not reach a route (health checks, requests refused before routing), and the metric does not count them. A request whose client left before the server could answer has the status `499` instead of a 5xx, unless a handler panicked; the client received nothing, so it does not count as a server error |
| `job` (`INFO` on success and for `postponed`, `WARN` for `retry`, `ERROR` for `dead`) | `my.job.type` and `my.outcome` have the same values as the labels of `my.job.duration`. Also `duration_seconds` (`my.job.duration`), `wait_seconds` (`my.job.wait`), `job_id`, `attempt`, and `error` on failure |
| `error report` (`ERROR`; `CRITICAL` for a failure that stops the process) | One line per reported error ([Error reports](#error-reports)) |
### Error reports
[Section titled “Error reports”](#error-reports)
The [Error reporting](/next/operations/error-reporting/) guide covers where to read these lines on each platform, the Errors screen, notifications, and sending reports to an error tracker.
The server reports the errors that need the operator’s attention as one `error report` line each:
* a panic in an HTTP handler, a job, or a background task;
* an error behind a 5xx response of the client API, the admin API, the sign-in pages, ActivityPub, OAuth, or media;
* a job that fails for good (`dead`): it ran out of retries, or refused to run again. Deliveries that gave up because the other server kept failing are not reported;
* a failure to start: an invalid configuration, or a database or adapter that cannot be set up.
4xx responses, job retries, the maintenance mode, failed readiness checks, requests whose client went away, and failures caused by other servers are not reported; the metrics and the other log lines cover them.
When a request’s client goes away, the server’s other error lines for that request are written at `INFO` instead of `ERROR`, since most of them only say that the request was canceled.
The line is in the form Google Cloud Error Reporting reads: on Cloud Run, the reports appear in Error Reporting grouped as errors without any setup. On other platforms it is a plain JSON line:
| Field | Value |
| -------------------------------------------------------- | ------------------------------------------------------------------------------------------------------------------------------------------------------------------------------------------------------------- |
| `@type`, `serviceContext` | The Error Reporting event type, and `{"service": "my", "version": ""}` |
| `my.error.fingerprint` | 32 hexadecimal digits that are the same for every occurrence of the same error: built from the source, the place, the error type, and the functions of the server in the stack, without line numbers |
| `my.error.source`, `my.error.kind` | `server` (or `web`), and `panic` or `error` |
| `my.error.where` | Where it happened: ` ` for a request (such as `client_api GET /api/v1/statuses/{id}`), the job type for a job, the task name for a background task, `startup` for a failure to start |
| `my.role`, `deployment.environment.name` | The `role` of the process and `errors_environment` |
| `request_id`, `job_id`, `attempt`, `trace_id`, `span_id` | The IDs to find the request or job lines of the same error, when it has them |
| `context.httpRequest` | For an error of a request: `method`, `url` (the route, such as `/api/v1/statuses/{id}`, never the path the client asked for), and `responseStatusCode`, the status answered (500) |
| `message` | Last on the line: `: `, a newline, and the Go stack |
Before a report leaves the process, the message has URLs, email addresses, `@user@host` handles, IP addresses, UUIDs and ULIDs, and numbers of 10 digits or more replaced with ``, ``, ``, ``, `` and ``, and is cut to 1 KiB. The stack keeps its file positions but not the argument values of its function lines (they are shown as `(...)`), and is cut to 16 KiB. No report carries a request body, header, query, cookie, account, user name, IP address, or User-Agent. No other line carries a stack, so Error Reporting finds the stacks of these lines only.
A field name is a single key that contains `.`; it is not nested. Quote it in Cloud Logging filters and extractions (for example `jsonPayload."http.route"`, and `EXTRACT(jsonPayload.duration_seconds)` for a distribution value). Fields used as labels take values from a finite set only; `url.path`, `request_id` and `job_id` are never labels.
With `metrics_exporter = emf`, these two lines are the EMF lines themselves. The `http request` line carries the value of `http.server.request.duration`, and the `job` line carries the values of `my.job.duration` and `my.job.wait` (keys named after the metrics), plus the `_aws` directive, `service.name`, `service.version` and `my.role`. These three metrics are not written on any other line. Fields you choose in `metrics_emf_dimensions` are written as strings, as EMF requires (for example the dimension `http.response.status_code` is `"200"`). Logs go to standard error and the other EMF lines go to standard output. The `awslogs` log driver of ECS sends both to CloudWatch Logs, so metrics are extracted from both.
## Docker Compose files
[Section titled “Docker Compose files”](#docker-compose-files)
`deploy/docker/` holds what deploys an instance. `compose.yaml` runs alone, and the other files layer on top of it.
| File | Adds | Use it when |
| ----------------------- | ------------------------------------------------------------------------------------------------------------------------------------------------------- | ------------------------------------------------------------------------------------------------------------------------------------------ |
| `compose.yaml` | The server and its one-off database services, on SQLite and media files in the volume `data` | Always |
| `compose.postgres.yaml` | PostgreSQL in a container, in the volume `postgres` | You want PostgreSQL on this machine. For a PostgreSQL server elsewhere, leave it out and set `MY_DATABASE` and `MY_DATABASE_URL` in `.env` |
| `compose.s3.yaml` | Media in an S3-compatible bucket; with `COMPOSE_PROFILES=garage` also a one-node [Garage](https://garagehq.deuxfleurs.fr/) store in the volume `garage` | Media outgrow one disk, or you want them in a bucket. Without the profile, the store is the external one of the `MY_BLOB_S3_*` settings |
| `compose.caddy.yaml` | Caddy, with TLS certificates on ports 80 and 443 | `MY_HOST` is a public domain and nothing else terminates TLS on this machine |
| `compose.build.yaml` | Builds the image from a checkout | You run your own build |
Choose the database and the media store before the first start: the data does not move by itself when the files change ([Backing up](/next/operations/backup/) shows what has to move).
**Layer files** with `-f` options in that order, or name them once in `.env`, so that every later `docker compose` command (`exec`, `logs`, `pull`, and those in the other guides) uses the same files:
```sh
cd deploy/docker
cp example.env .env
# In .env: COMPOSE_FILE=compose.yaml:compose.postgres.yaml:compose.caddy.yaml
```
A file named `compose.override.yaml` in the directory is read only when neither `-f` nor `COMPOSE_FILE` names files. With them, list it as well.
**Settings.** Copy `example.env` to `.env`. Compose reads `.env` to fill in the variables of its files, and hands the whole file to the server’s containers, so every setting of the [configuration reference](/next/reference/configuration/) works by being set there. The template lists them all, with a sentence on each.
* The key-encryption key stays out of `.env`, in the file `secrets/kek`, and the containers read it as the Docker secret `/run/secrets/my_kek`, so it never becomes an environment variable. A `MY_KEK` line in `.env` stops the server, which refuses `MY_KEK` and `MY_KEK_FILE` together ([managing the key](/next/operations/key-management/)).
* The server runs as the user `65532`, and Compose mounts the file with the permissions it has, so the file has to be readable by others. Keep it in a directory only you can enter, as the commands in `example.env` do.
* The other secrets reach the containers as environment variables. To pass one as a file instead, mount it with a secret in a `compose.override.yaml` of your own and set its `_FILE`, as `compose.yaml` does for the key.
* `.env` holds secrets: `chmod 600 .env`, and keep a copy with your backups.
* `MY_LISTEN` stays `:8080`, since the files connect to that port, unless the server serves HTTPS itself ([Serving HTTPS from the server](#serving-https-from-the-server)).
**TLS with Caddy.** Set `MY_HOST` to a domain whose DNS points at the machine, with ports 80 and 443 reachable from the internet, and remove `MY_WEB_ORIGIN` from `.env`. Caddy gets and renews the certificate by itself on the first request. The server trusts the `X-Forwarded-For` of Docker’s default address pools; set `MY_TRUSTED_PROXIES` if yours differ.
**The bundled Garage.** `compose.s3.yaml` with `COMPOSE_PROFILES=garage` needs the values that `example.env` lists at its top. The one-off service `garage-init` prepares the store on each `up`. It stays inside the Compose network, since the server serves the media itself. One node is one disk: back up the volume `garage` or the bucket ([Backing up](/next/operations/backup/#media-in-a-bucket)).
## Serving HTTPS from the server
[Section titled “Serving HTTPS from the server”](#serving-https-from-the-server)
`my` can serve HTTPS itself, so that a small machine runs the whole server as one binary with a domain and ports 80 and 443, without a reverse proxy. With `tls = acme`, it obtains its certificates from an ACME certificate authority such as Let’s Encrypt. With `tls = files`, it serves a certificate and key that you provide and keep up to date with another tool, such as certbot.
```sh
MY_TLS=acme
MY_TLS_ACME_AGREE_TERMS=true # you agree to the terms of service of the certificate authority
# MY_TLS_ACME_EMAIL=ops@social.example optional contact of the account
# MY_LISTEN=:443 the default with tls other than off
# MY_TLS_HTTP_LISTEN=:80 the default; empty opens no port 80
```
```sh
MY_TLS=files
MY_TLS_CERT_FILE=/etc/letsencrypt/live/social.example/fullchain.pem
MY_TLS_KEY_FILE=/etc/letsencrypt/live/social.example/privkey.pem
```
* **Ports.** The server serves HTTPS on `listen` (`:443` by default once `tls` is not `off`). On `tls_http_listen` (`:80` by default) it sends `GET` and `HEAD` requests to the same path on `https` with `301`, and answers `400` to every other method, so that no request body travels in plain text.
* **Hosts.** The server serves `host`, and the host of `web_origin` when that differs. A handshake for any other name fails without a certificate, and never makes the server order one.
* **Connections.** TLS 1.2 or later with Go’s default cipher suites, HTTP/2 and HTTP/1.1, at most 64 KiB of request headers, and at most 100 concurrent streams on an HTTP/2 connection. The timeouts are those of plain HTTP. The server still adds `Strict-Transport-Security` to every response ([Security headers](#security-headers)).
* **Roles.** Only the `web` and `all` roles listen with TLS. A `worker` serves its health checks in plain HTTP on `listen` (`:8080` by default) and opens no port 80.
* **Client addresses.** Without a proxy in front, the connection’s peer is the client: leave `trusted_proxies` empty. Set it only when a CDN in front connects to the server over `https`.
* **Maintenance mode.** `my serve -maintenance` reads neither `tls` nor the certificates and answers in plain HTTP on `listen` (`:8080` unless you set it), so point `MY_LISTEN` and your firewall at that port while it runs, or keep a reverse proxy for maintenance.
### Certificates from an ACME certificate authority
[Section titled “Certificates from an ACME certificate authority”](#certificates-from-an-acme-certificate-authority)
With `tls = acme`, the server orders a certificate for each of its hosts that has none, from the certificate authority at `tls_acme_directory` (Let’s Encrypt by default).
* **Before you start.** `host` must be a DNS name that points at the server, and ports 443 and 80 must be reachable from the internet: the certificate authority checks that the server controls the name by connecting to it. It answers on `listen` (the TLS-ALPN-01 challenge) or on `tls_http_listen` (the HTTP-01 challenge), so an empty `tls_http_listen` still works with port 443 alone. Wildcard certificates and validation through DNS records are not available.
* **First start.** The server starts listening without waiting for a certificate, then orders them. Until a host has its certificate, a handshake for it fails; with Let’s Encrypt the first certificates usually come within a minute. The log says `obtained a TLS certificate` for each host, and `the TLS certificate could not be obtained` with the reason when an order fails.
* **Renewals.** The server renews each certificate at the time the certificate authority suggests for it (ACME Renewal Information): it picks a random time inside the suggested window once, keeps it while the window stays, and asks again as the authority’s `Retry-After` says, at least every 12 hours, so that an authority that must replace certificates early can move the window. When the authority offers no such window, the server renews after two thirds of the certificate’s lifetime, or after half of it for a certificate valid for less than 10 days. A renewal tells the authority which certificate it replaces, which keeps it outside Let’s Encrypt’s rate limits. The current certificate stays in service until its renewal comes, and a renewal that fails waits as a first order does.
* **Failed orders.** After a failed order the server waits before the next one for the same host: 1 minute after the first failure, 10 minutes after the second, 100 minutes after the third, then a day, so that it stays within the certificate authority’s limits. The wait is kept in the database and survives restarts. Fix the cause (DNS, a firewall, a port) and the next order goes out when the wait ends.
* **Where they are kept.** The account with the certificate authority, the certificates, and the record of every order are kept in the database; the private keys are sealed with the key-encryption key, like the other secrets ([key management](/next/operations/key-management/)). A backup of the database includes them, and a restarted server serves the stored certificates at once, without ordering. Changing the key-encryption key re-wraps them; it does not order new certificates.
* **Several processes.** Processes that share the database and the `kv` store coordinate: one orders the certificate of a host while the others wait and then load it, and whichever process the certificate authority connects to answers its check. Use `kv = db` or `kv = valkey`; `kv = memory` is refused unless one process runs everything (`role = all`). The process that obtains a certificate tells the others through the [`stream`](/next/reference/configuration/#stream) broker, and they serve it within seconds; each `web` process with `tls = acme` therefore keeps listening on the broker. With `stream = hub`, or when a notice is lost, every process still reads the current certificates from the database every 5 minutes, and every minute once its certificate has reached its renewal time, so a renewal reaches them well before the old certificate expires.
* **Profiles.** `tls_acme_profile` picks a profile that the certificate authority offers, such as `shortlived` at Let’s Encrypt. Empty takes its default. After a change of profile, the next renewal follows it, and the certificate it brings is served even when it expires before the one it replaces.
To try it without spending the limits of Let’s Encrypt’s production environment, start with its staging environment, which issues certificates that browsers do not trust under much higher limits:
```sh
MY_TLS_ACME_DIRECTORY=https://acme-staging-v02.api.letsencrypt.org/directory
```
Once the log says the certificates were obtained and `curl -kv https://social.example/` shows a certificate from `(STAGING)`, remove the setting and restart. The server registers a new account with the production environment and orders its certificates there; the staging ones stay in the database and are no longer served.
### Certificates from files
[Section titled “Certificates from files”](#certificates-from-files)
With `tls = files`, `tls_cert_file` holds the server’s certificate first, then its intermediates (certbot’s `fullchain.pem`); `tls_key_file` holds its key. The certificate must cover `host`, and it also serves the host of `web_origin` when that differs and the certificate covers it.
The server looks at the modification times of both files every minute and loads them again when either changes, without a restart. A pair that does not match yet (a new certificate before its new key) keeps the previous certificate in service until the next check, and the log says why.
### Commands and metrics
[Section titled “Commands and metrics”](#commands-and-metrics)
`my tls` shows and controls the certificates with the server’s configuration, from any machine that reaches the database (the [admin CLI](/next/operations/admin-cli/#tls-certificates)):
```sh
my tls status # each host: certificate, renewal, latest orders
my tls renew -host social.example # order now, without waiting
my tls revoke -host social.example -reason key_compromise
```
* **`status`** shows, for each host, the current certificate (its serial, issuer, and expiry), when it is renewed (the certificate authority’s window, or the time derived from its lifetime), how many orders in a row obtained none, and the latest orders with their errors. With `tls = files` it shows the certificate of `tls_cert_file`.
* **`renew`** orders a certificate now, skipping the renewal time and the wait after failed orders: run it once you have fixed the cause of failed orders. The running server answers the certificate authority’s check, so it must be up, and its processes serve the new certificate within seconds, or within 5 minutes with `stream = hub`.
* **`revoke`** first orders a certificate that replaces the current one, then asks the certificate authority to revoke the current one and records it; every process stops serving the revoked certificate within seconds, or within 5 minutes with `stream = hub`. Use `key_compromise` when the private key may be known to others, `superseded` or `operator` otherwise. When the replacement cannot be ordered, the revocation still goes ahead: the processes serve the host’s previous certificate if it is not revoked, or nothing until the server obtains a new one.
* `renew` and `revoke` need `tls = acme` and a `kv` other than `memory`, since the processes that the certificate authority connects to read the answers to its checks from the `kv` store. With `tls = files` they are refused: renew or revoke the certificate with the tool that writes the files.
With [`metrics_exporter`](#metrics) set, alert on `my.tls.certificate.expiry` under 7 days and on `my.tls.order.consecutive_failures` of 3 or more ([alerts](/next/operations/alerts/#mytlscertificateexpiring)): a failing renewal shows weeks before the certificate expires.
### Checks and running it
[Section titled “Checks and running it”](#checks-and-running-it)
`my config check` reports, with `tls = acme`, terms that are not agreed to, a `host` that is an IP address, `localhost`, or a name without a dot, a `tls_acme_directory` that is not an `https` URL, and `kv = memory` with a `role` other than `all`, as errors. With `tls = files` it reports a certificate or key that cannot be read, a key that does not match the certificate, and a certificate that does not cover `host`, has expired, or is not valid yet, as errors, and warns when fewer than 14 days are left. It warns when `trusted_proxies` is set with `tls` other than `off`. With `tls = off` it warns when `listen` is port 80 or 443 on an address other than loopback, since nothing seems to terminate TLS in front of the server; the server logs the same warning once per start when such a server, with `trusted_proxies` empty, gets a plain HTTP request from an address other than loopback.
**systemd.** Ports below 1024 need a capability for a user other than root. Give it to the service and nothing else:
```ini
[Service]
User=my
AmbientCapabilities=CAP_NET_BIND_SERVICE
CapabilityBoundingSet=CAP_NET_BIND_SERVICE
```
With `tls = files`, the user also needs to read the certificate files. With certbot, its `live` and `archive` directories are readable only by root: grant the group of the service access (`chgrp` and `chmod g+rx` on the directories, `g+r` on the keys), or copy the files in a deploy hook to a directory that the service reads.
**Docker.** Docker 20.10 and later let a container open ports below 1024 without a capability, so the image works as it is. The image sets `MY_LISTEN=:8080`, so set `MY_LISTEN=:443` in `.env`, publish both ports in a `compose.override.yaml` (`ports: ["80:80", "443:443"]`). With `tls = files`, mount the certificate files read-only where `MY_TLS_CERT_FILE` and `MY_TLS_KEY_FILE` point; the server runs as the user `65532`, which must be able to read them. With `tls = acme` there is nothing to mount: the certificates live in the database. Leave out `compose.caddy.yaml`, which would take the same ports. This does not hold with `network_mode: host`, where the container shares the machine’s network and needs the same capability as a service outside a container.
**Compared with Caddy.** Serving HTTPS from `my` gives up HTTP/3, compression of responses (the server sends the web client’s files compressed and compresses nothing else), an access log of its own (the server’s `http request` log lines remain), and certificates validated through DNS, including wildcard certificates. Keep `compose.caddy.yaml`, or another proxy, when you need any of these.
## Get the image
[Section titled “Get the image”](#get-the-image)
The server image is `ghcr.io/mycroblog/my`, public, for `linux/amd64` and `linux/arm64`, with every adapter.
| Tag | Points at | Use it for |
| ------------ | --------------------------------------------------------------------------------------- | --------------------------------------------------------------------- |
| `0.1.0` | That version, for good | Naming a version |
| `0.1` | The latest patch of `v0.1` | Docker Compose, which applies the schema on every `up` |
| `0.1.0-rc.1` | That prerelease | Trying a release before it comes out |
| `nightly` | The latest commit of `main` that passed the nightly tests, moved every night it changes | Trying changes before a prerelease, on an instance you can throw away |
There is no `latest` and no `0`: both would cross a minor version, and each upgrade to a new minor version has to go [through the previous one](/next/operations/database/#skipping-releases). Name a version in every command; `docker pull ghcr.io/mycroblog/my` alone fails with `manifest unknown`. A patch release can need `my schema apply` and `my db upgrade` too, so outside Docker Compose follow [Upgrading](/next/operations/database/#upgrading) for each version. In production, pin the digest that the release’s notes give:
```text
ghcr.io/mycroblog/my:0.1.0@sha256:...
```
**`nightly` has no upgrade path.** Upgrades are promised only between released versions: from one `nightly` image to the next, or from `nightly` to a release, the schema and the data steps of `my db upgrade` can change in ways that no release goes through, so expect to recreate its database. Never run it in production. `my version` prints which commit it is, as in `v0.1.0-rc.5.0.20261109182600.g7a789720a1b2`: a version after the latest release (`v0.1.0-rc.5`), the commit’s time in UTC, and the first 12 characters of the commit after `g`. To keep one build, pin its digest (`ghcr.io/mycroblog/my:nightly@sha256:...`): an older build loses the tag but stays pullable by its digest.
Where to run it:
* **Docker Compose**: `deploy/docker/compose.yaml` runs the image of `MY_VERSION` in `.env` ([Docker Compose files](#docker-compose-files)). To build it from a checkout instead, add the override `compose.build.yaml` (`docker compose -f compose.yaml -f compose.build.yaml up -d --build`), and set `MY_VERSION` to a name of your own, since it names your local image and is what `my version` prints.
* **Kubernetes**: pull it from `ghcr.io` as it is.
* **Cloud Run**: use the `ghcr.io` image directly. A deployment resolves the tag to a digest.
* **AWS (ECS, EKS)**: copy the image to Amazon ECR, or use an ECR pull through cache, which needs ghcr.io credentials.
### Verify an image
[Section titled “Verify an image”](#verify-an-image)
Each released image has provenance signed through Sigstore, which ties the digest to the workflow and the commit that built it, and an SBOM. With the [GitHub CLI](https://cli.github.com/), and logged in to `ghcr.io` if the command asks for it:
```sh
gh attestation verify oci://ghcr.io/mycroblog/my@sha256:... -R mycroblog/my \
--signer-workflow mycroblog/my/.github/workflows/release.yml
docker buildx imagetools inspect ghcr.io/mycroblog/my@sha256:... --format '{{ json .SBOM }}'
```
The first command fails unless the image was built by the release workflow of this repository. For a `nightly` image, verify it with `--signer-workflow mycroblog/my/.github/workflows/nightly.yml` instead. It prints the commit, which is the commit of the version’s tag; the image’s label `org.opencontainers.image.revision` names the same one.
## Publish the source code (AGPL-3.0)
[Section titled “Publish the source code (AGPL-3.0)”](#publish-the-source-code-agpl-30)
`my` is licensed under AGPL-3.0-only. Section 13 of the AGPL-3.0 requires anyone who runs the server and lets users interact with it over a network to offer those users a way to get the corresponding source code of the program that is running. This applies to everyone who interacts with the server, not only to people with an account.
Point to where the source is published with the setting `source_url` (environment variable `MY_SOURCE_URL`; see the [configuration reference](/next/reference/configuration/#source_url)).
| Value | Meaning |
| --------------- | ---------------------------------------------------------------------------------------------------------------------------------------------------------------------------------------------------------------------------------- |
| Not set | The default, `https://github.com/mycroblog/my`. Use it when you run `my` unmodified: a release’s `GET /instance` then names the source of that version, `https://github.com/mycroblog/my/tree/v0.1.0`, and NodeInfo the repository |
| An `https:` URL | A place where the source can be read (the repository of a fork, the tag or archive of a particular version, and so on) |
| A `mailto:` URI | An email address to request the source from (for example `mailto:source@example.org`; `?subject=...` is allowed) |
Any other value (`http:`, `git@...`, a relative path, a URL with user information or a `#`, a `mailto:` without an address, and so on) makes `my config check` fail, and the server does not start.
The value appears in these places:
* `source_url` in the client API’s `GET /instance`
* The “Source code” section of the web client’s instance information page (`/about`) and a link on the landing page (`/`)
* `metadata.sourceCode` in NodeInfo (`/nodeinfo/2.1`). An `https:` URL is also published as `software.repository` (the NodeInfo 2.1 schema allows only an `http(s)` URL in `software.repository`, so a `mailto:` value appears only in `metadata.sourceCode`)
### When you fork or modify `my`
[Section titled “When you fork or modify my”](#when-you-fork-or-modify-my)
If you run a modified `my` (you apply patches, build a fork, or swap dependencies), the default URL no longer points to the source of what is running. Change `source_url` to where the source of the running version, with your modifications, can be found. Pointing to the commit, tag or archive that matches the running version, rather than the latest state of a repository, lets users reliably get the same source. If you run an unmodified official release, keep the default.
### When you use `mailto:`
[Section titled “When you use mailto:”](#when-you-use-mailto)
* Be ready to hand over the corresponding source code (including the scripts needed to build it) promptly when someone asks. Only naming an address, without being prepared to deliver, does not meet the obligation.
* Use an address that still works after you stop operating the server or the person in charge changes. A shared operations address is better than a personal inbox.
* Make sure spam filtering does not drop requests.
* Use an address you are happy to make public: anyone can see it on the information page, the landing page and in NodeInfo.
## Metrics
[Section titled “Metrics”](#metrics)
The setting `metrics_exporter` (default `none`) exports service metrics. Its related settings are in the [configuration reference](/next/reference/configuration/).
| `metrics_exporter` | Path | Suited to |
| ------------------ | ------------------------------------------------------------------------------------------------------------------------------------------------------------------------------------------------------------ | -------------------------------------------------------------------- |
| `none` | Nothing is exported. Instrumentation costs almost nothing. The instance-wide values still go to one `metrics snapshot` log line every 15 minutes | Cloud Run (use the platform’s metrics and log-based metrics instead) |
| `prometheus` | `GET /metrics` on `metrics_listen` (default `127.0.0.1:9464`). It is a listener separate from the public `listen`, with no authentication, and runs for every `role` | Self-hosted (scraped by a Prometheus-compatible server or KEDA) |
| `otlp` | Sent to an OpenTelemetry Collector over OTLP/HTTP. The destination comes from the standard OTel environment variables such as `OTEL_EXPORTER_OTLP_ENDPOINT` | Setups where you can run a collector |
| `emf` | CloudWatch Embedded Metric Format JSON lines. Request and job metrics ride on the closing log lines above; the others are written to standard output, one line per label set, when a request or job finishes | AWS ECS |
The metrics are listed below. In Prometheus, `.` in a name becomes `_` and a unit suffix (`_seconds`, and `_total` for a counter) is added.
| Metric | Kind | Labels |
| ------------------------------------------- | ------------------ | ---------------------------------------------------------------------------------------------------------------------------------------------------------------------------------------------------------------------------------------------------------------------------------------------------------------------------------------------------------------------------------------------------------------------------------------------------------------------------------------------------- |
| `http.server.request.duration` | Histogram, seconds | `http.request.method`, `http.route` (the route pattern’s path; `other` when none matches), `http.response.status_code`, `my.surface` (`client_api` / `admin` / `activitypub` / `oauth` / `media` / `web` / `payments` / `voice` / `queue`) |
| `http.server.active_requests` | UpDownCounter | `my.surface` |
| `my.inbox.activities` | Counter | `activity.type` (a known Activity type, or `other`), `my.outcome` (`accepted` / `duplicate` / `rejected` / `ignored` / `error`), `my.inbox.rejection` (only with `rejected`: `signature` for a signature or integrity proof that is missing, invalid or does not verify, or whose key could not be fetched; `suspended` for a suspended domain; `federation_off`; `rate_limited`; `invalid` for an activity without a valid `id`, `type`, `actor` or `object`) |
| `my.relay.activities` | Counter | `my.outcome` (`admitted` / `over_limit` / `restricted` / `not_receiving`: whether an activity carried by a relay was ingested, and why it was dropped; see [Federation relays](/next/operations/relays/)) |
| `my.move.activities` | Counter | `my.outcome` (`recorded` / `duplicate` / `not_own_actor` / `same_account` / `target_unavailable` / `alias_missing` / `target_moved` / `suspended` / `too_soon`: whether a received `Move` was recorded, and why it was dropped) |
| `my.delivery.attempts` | Counter | `my.outcome` (`success` / `retry` / `gone` / `failed`; `gone` covers a 410 and deliveries skipped because the server is unavailable or suspended) |
| `my.delivery.duration` | Histogram, seconds | `my.outcome` |
| `my.ux.duration` | Histogram, seconds | `my.ux.metric` (`lcp` / `inp` / `long_frame` / `transition` / `press` / `call_rtt` / `call_jitter`), `my.ux.name` (the route, interaction kind, action, or call transport; [UX measurements](/next/operations/error-reporting/#ux-measurements)) |
| `my.ux.call.packet_loss` | Histogram, percent | `my.ux.name` (the call transport) |
| `my.plugin.failures` | Counter | `my.plugin.kind` (a kind of [plugin](/next/operations/plugins/)), `my.plugin.code` (the Connect code of the failure) |
| `my.plugin.slot_wait` | Histogram, seconds | `my.plugin.kind` (how long a call waited for its turn among the calls of that kind that run at once) |
| `my.hook.decisions` | Counter | `hook`, `mode`, `outcome` (the decisions a [decision hook](/next/operations/decision-hooks/) recorded) |
| `my.hook.failures` | Counter | `hook`, `outcome` (`timeout`, `error`, `invalid`, or `breaker_open`) |
| `my.hook.duration` | Histogram | `hook` (seconds per call of the plugin) |
| `my.job.duration` | Histogram, seconds | `my.job.type` (a registered job type, or `other`), `my.outcome` (`success` / `retry` / `dead` / `postponed`: `postponed` is a run that did no work and uses none of the job’s attempts, such as a link card fetch that waits for its host) |
| `my.job.wait` | Histogram, seconds | `my.job.type` |
| `my.link_card.host_pauses` | Counter | `http.response.status_code` (`429` / `503`). One per pause of the link card fetches from a host; see [Link previews](/next/operations/link-previews/#limits-per-host) |
| `my.translation.requests` | Counter | `my.outcome` (`author` / `cache` / `provider` / `no_provider` / `limit` / `unsupported` / `failed`). One per request to translate a post that the viewer may see, or a report’s post or comment that a moderator asks for: answered from the author’s own words, from a kept translation, or by a provider, or refused because no provider may receive the post, a monthly limit is reached, no provider translates the language, or no provider returned a usable translation. |
| `my.translation.lock_waits` | Counter | None. One per request that waited for another request translating the same post into the same language, instead of asking a provider |
| `my.translation.characters` | Counter | `my.provider` (the ID of a translation provider). The characters of posts and report comments sent to the provider, without markers, including calls that fail. This is what the [monthly limits](/next/operations/instance-settings/#admin-screens-and-the-client-api) count, and it can differ from what the provider bills |
| `my.timeline.delivery.lag` | Histogram, seconds | None (from the creation of a local post to its write into home timelines and the notification to streams) |
| `my.stream.connections` | UpDownCounter | `my.stream.kind` (`user`, `timeline` for the streams of the local and federated timelines, `voice` for the streams of the voice chat rooms) |
| `my.stream.signals` | Counter | `my.stream.kind` (`user` / `timeline`). One per signal that an open stream handled, whether or not it sent the client anything |
| `my.accounts.registered` | Counter | None |
| `my.statuses.created` | Counter | `my.visibility` |
| `my.billing.imports` | Counter | `my.billing.source` (`aws` / `gcp` / `plugin`), `my.outcome` (`success` / `failed`), `error.type` (only with `failed`: the kind of failure, as in [Importing cloud usage charges](/next/operations/billing-import/)). Every attempt counts, including the retries and the failures that wait for the next daily import |
| `my.supporter.tip_checkouts` | Counter | `my.outcome` (`started` / `rate_limited` / `paid` / `expired`). One per start of a tip that got the provider’s page, per start that the limits refused, and per tip that was paid or ended unpaid; see [tips](/next/operations/supporters/#tips) for the alerts it serves |
| `my.voice.turn.credentials` | Counter | `my.voice.turn` (`coturn` / `cloudflare`), `my.outcome` (`issued` / `reused` / `failed`). One per TURN credential that a voice chat participant asked for when joining a room or renewing its connection: `reused` means Cloudflare credentials issued earlier for the same connection were returned again, and `failed` means Cloudflare could not be reached or refused, so the participant got an error and could not connect |
| `my.errors.exported` | Counter | `my.outcome` (`success` / `dropped` / `failed`: one per error report for the service of `errors_exporter`. `dropped` means the report was not sent because 1,000 reports were already waiting or the service asked the server to slow down, and the server waits as long as the service asks before sending again; `failed` means the service could not be reached or refused the report. A report is sent once and never retried, and the reports still waiting 2 seconds into a shutdown are lost) |
| `my.queue.ready` | Gauge | `my.job.type` (the number of runnable jobs in the database queue) |
| `my.queue.oldest_ready_age` | Gauge, seconds | `my.job.type` (how long the oldest runnable job of each type in the database queue has waited; a type with no runnable job has no value) |
| `my.queue.dead` | Gauge | None |
| `my.instance.users`, `my.instance.statuses` | Gauge | None (the local user and post counts, as in NodeInfo) |
| `my.media.stored_bytes` | Gauge, bytes | `my.media.origin` (`local` / `remote_cache`) |
| `my.db.size` | Gauge, bytes | None (the size of the database: `pg_database_size` for PostgreSQL; the database file without its write-ahead log for SQLite) |
| `my.billing.import.failing` | Gauge | `my.billing.source` (1 when the newest import of the source failed, 0 otherwise) |
| `my.federation.instances` | Gauge | `my.federation.instance.state` (`available`: servers that deliveries still go to but that failed on at least one day since they last answered; `unavailable`: servers whose deliveries are paused) |
| `my.metrics.snapshot.age` | Gauge, seconds | `my.metrics.snapshot.part` (`queue` / `totals`) |
| `my.errors.reported` | Counter | `my.error.source` (`server` / `web`), `my.error.kind` (`panic` / `error`). One per [error report](#error-reports) |
| `my.tls.certificate.expiry` | Gauge, seconds | `host` (the time until the certificate that this process serves for one of its hosts expires, with `tls = acme` or `tls = files`; each process reports its own, so a process left with an old certificate shows. See [Commands and metrics](#commands-and-metrics)) |
| `my.tls.order.attempts` | Counter | `host`, `result` (`issued` / `failed`). One per order of a certificate from the ACME certificate authority, by the process that placed it, `my tls renew` and `my tls revoke` included |
| `my.tls.order.consecutive_failures` | Gauge | `host` (the orders since the host’s current certificate that obtained none: the count that sets the wait before the next order) |
| `my.tls.rounds` | Counter | None. One per round of the certificate manager over its hosts with `tls = acme`; a count that stops growing means the manager stopped |
Health checks (`/healthz`, `/readyz`, `/health/live`, `/health/ready`) are not measured. No label contains a remote domain, account, URL or client IP. `my.queue.*`, `my.instance.*`, `my.media.stored_bytes`, `my.db.size`, `my.federation.instances` and `my.billing.import.failing` are values for the whole instance: every process reports the same value from one snapshot kept in the key-value store.
### System metrics
[Section titled “System metrics”](#system-metrics)
Metrics about the process, the Go runtime and connections to resources are exported through the same `metrics_exporter`. Container CPU, memory, instance count and ingress requests are left to the platform’s metrics; these cover saturation inside the process that the platform cannot see. Do not use them to trigger scaling; use them for alerts and for estimating the instance cap.
| Metric | Kind | Labels |
| -------------------------------------------------------------------------------------------------- | -------------------------------------------------------- | --------------------------------------------------------------------------------------------------------------------------------------------------------------------------------------------------------------------------------------------------------------------------------------------------------------------------------------------------------------------- |
| `go.memory.used`, `go.memory.limit`, `go.memory.gc.goal` | Gauge, bytes | Only `go.memory.used` has `go.memory.type` (`stack` / `other`). `go.memory.limit` appears only when `GOMEMLIMIT` is set |
| `go.memory.allocated`, `go.memory.allocations` | Counter | None |
| `go.goroutine.count`, `go.processor.limit`, `go.config.gogc` | Gauge | None |
| `go.schedule.duration`, `go.memory.gc.pause.duration` | Histogram, seconds | None (the wait from becoming runnable to running, and GC pauses) |
| `go.memory.gc.cycles` | Counter | None |
| `process.cpu.time` | Observable Counter, seconds (total since start) | `cpu.mode` (`user` / `system`) |
| `process.memory.usage` | Gauge, bytes | None (resident memory, RSS) |
| `process.unix.file_descriptor.count`, `my.process.file_descriptor.limit` | Gauge | None (open file descriptors and the limit) |
| `process.uptime` | Gauge, seconds | None |
| `db.client.connection.count` | Gauge | `db.client.connection.pool.name` (`postgres` / `sqlite`), `db.client.connection.state` (`idle` / `used`) |
| `db.client.connection.max` | Gauge | `db.client.connection.pool.name` |
| `db.client.connection.wait_time`, `my.db.client.connection.waits`, `db.client.connection.timeouts` | Observable Counter (total since start; seconds or count) | `db.client.connection.pool.name`. `timeouts` is PostgreSQL only |
| `my.adapter.operation.duration` | Histogram, seconds | `my.adapter` (`queue.db` / `kv.db` / `kv.memory` / `kv.valkey` / `stream.` / `blob.fs`), `my.operation`, `my.outcome` (`success` / `error`) |
| `my.adapter.connections` | UpDownCounter | `my.adapter` (`valkey` connections, and `stream.` subscribers) |
| `my.adapter.reconnects` | Counter | `my.adapter` |
| `http.client.request.duration` | Histogram, seconds | `my.http.purpose` (`json` / `html` / `image` / `video` / `human_check` / `web_push` / `webhook` / `client_metadata` / `login_provider` / `robots` / `domain_list`), `http.request.method`, `my.http.status_class` (`2xx` and so on), `error.type` (`forbidden_destination` is a refusal by the SSRF guard) |
| `http.client.open_connections` | UpDownCounter | None |
| `my.readiness.failures` | Counter | None |
| `my.readiness.shared` | Counter | None. One per readiness request that took the result of a check already running instead of starting one |
| `my.http.origin_refused` | Counter | None. One per request refused because it did not come through the CDN ([`origin_secret`](/next/operations/cdn/#refuse-requests-that-did-not-come-through-the-cdn)). Probes of the origin’s address raise it slowly; a jump while the traffic stops means the CDN no longer sends the header. The maintenance mode measures nothing, so only its access log shows them |
* Go runtime metrics (`go.*`) are exported only by `prometheus` and `otlp`. With `emf`, a periodic snapshot job writes the process and connection-pool gauges and observable counters.
* Pool waits and CPU time are Observable Counters: the pool and the kernel keep totals since start, and they are read at collection time. In Prometheus they are `_total` counters (such as `process_cpu_time_seconds_total`), in OTLP they are monotonic sums, and you see their growth with PromQL `rate()`. `emf` has no total counters, so it writes the increase since the previous write (add them up with the CloudWatch Sum statistic).
* Queue `claim` is measured only when it takes a job or fails. A waiting worker’s polling records nothing.
* `db.client.connection.pending_requests` is not exported: the pgx and `database/sql` statistics do not report how many are waiting, so the number and duration of waits stand in for it.
* Alert on the ratio of the sum of `go.memory.used` to `go.memory.limit`, and on the growth of `db.client.connection.wait_time` (the pool limit is being hit).
### Memory limit (`GOMEMLIMIT`)
[Section titled “Memory limit (GOMEMLIMIT)”](#memory-limit-gomemlimit)
`GOMEMLIMIT` is a Go runtime environment variable that the operator sets; the application does not choose it. Without it, Go runs with its default (no limit), and the heap does not collect eagerly as it approaches the container’s memory limit. On setups with a container memory limit (Cloud Run, ECS, Kubernetes), set it to about 90% of that limit (for example `GOMEMLIMIT=460MiB` for a 512 MiB container). Do not set `GOMAXPROCS`: Go’s default follows the container’s CPU limit.
## Traces
[Section titled “Traces”](#traces)
The setting `traces_exporter` (default `none`) exports distributed traces. Its related settings are in the [configuration reference](/next/reference/configuration/).
| Span | Name | Attributes |
| ------------------------ | ------------------------------------------------------------------------------------------------ | -------------------------------------------------------------------------------------------------------------------------------- |
| HTTP request (server) | ` ` (`` for a request that did not reach a route) | `http.request.method`, `http.route`, `http.response.status_code`, `my.surface`. A 5xx is a failure |
| Job execution (consumer) | The job type (`my.job.type`) | `my.job.type`, `my.job.attempt`, `my.outcome`. Each retry is a separate span |
| Transaction | `my.db.transaction` | `db.system.name`. Each retry is a separate span |
| Query (client) | The sqlc query name (such as `InsertJobs`; otherwise the first word of the SQL, such as `BEGIN`) | `db.system.name`, `db.operation.name` |
| Delivery (`my.delivery`) | `my.delivery` | `activity.type`, `my.outcome` |
| Outgoing HTTP (client) | `` | `http.request.method`, `server.address` (the destination host name only), `http.response.status_code`. A 4xx or 5xx is a failure |
A failed span has `error.type` (a finite name such as `timeout`, or a status code). Attributes never contain account, post or job IDs, URLs, paths or queries, client IPs, User-Agent values, SQL text or error strings. `server.address` leaves the host names of remote servers with the receiver, so you decide how long the receiver keeps them and who can view them. Health checks and the requests refused by `origin_secret` create no span.
* A job execution is not a child of the span that enqueued it (usually an HTTP request). It is the **root of a new trace** with a link to the enqueuing span. In a viewer, follow the link from the request’s trace.
* An incoming `traceparent` becomes the parent only when the connecting peer is in `trusted_proxies` and, with [`origin_secret`](/next/operations/cdn/#refuse-requests-that-did-not-come-through-the-cdn), the request carries the secret. Otherwise it is discarded and a new trace starts. `tracestate` is always discarded. Outgoing HTTP (federation, WebFinger, media, Web Push and so on) carries no `traceparent`.
* Sampling: a request is recorded if its trusted-proxy parent was recorded, or if the link target of a job was recorded; otherwise it is recorded at the ratio `traces_sample_ratio` (default 0.01). Lowering the ratio never leaves the jobs that continue a recorded request without their trace.
| Target | Settings | Path |
| ----------------------------------------------------------------- | ------------------------------------------------ | -------------------------------------------------------------------------------------------------------------------------------------------------------------------------------------------------------------------------------------------------------------------------------------- |
| Default, small self-hosted | `traces_exporter = none` | No spans are exported. Follow `request_id` and `job_id` in the logs. If a trusted proxy supplies a `traceparent`, its `trace_id` and `span_id` are added to the logs |
| Self-hosted (Jaeger, Tempo, an OpenTelemetry Collector and so on) | `traces_exporter = otlp`, `traces_flush = batch` | Sent over OTLP/HTTP to the receiver at `OTEL_EXPORTER_OTLP_TRACES_ENDPOINT` (or `OTEL_EXPORTER_OTLP_ENDPOINT`, default `http://localhost:4318`). Authentication headers go in `OTEL_EXPORTER_OTLP_HEADERS`. To reliably keep errors and slow traces, use the Collector’s tail sampling |
| Google Cloud (Cloud Run) | `none`, or `otlp` with `unit` to enable traces | See below |
| AWS (ECS) | `none`, or `otlp` with `batch` to enable traces | See below |
### Cloud Run
[Section titled “Cloud Run”](#cloud-run)
Even with `none`, the request trace that Cloud Run creates automatically and the `trace_id` in the logs share the same ID (when you trust the connection from in front of Cloud Run with `trusted_proxies`). Whether Cloud Run always overwrites the `traceparent` of public requests is not yet verified. The logs are not shaped as the trace field that Cloud Logging recognizes (`logging.googleapis.com/trace`).
To send application spans to Cloud Trace, run an **OpenTelemetry Collector as a sidecar** in the same service. The server holds no Google credentials; the sidecar sends to the Cloud Trace OTLP endpoint with Application Default Credentials.
* Server (the ingress container): `MY_TRACES_EXPORTER=otlp`, `MY_TRACES_FLUSH=unit`, `OTEL_EXPORTER_OTLP_ENDPOINT=http://localhost:4318`
* Sidecar: an OpenTelemetry Collector that receives with an `otlp` receiver over HTTP on `localhost:4318` and sends with the `googlecloud` exporter, or the `otlphttp` exporter (`https://telemetry.googleapis.com`, with the `googleclientauth` extension). Grant the service account permission to write to Cloud Trace.
* At the end of each recorded request or job, `unit` flushes the spans so far to the sidecar before returning. So that the sidecar can send them while no CPU is allocated, use instance-based billing for a setup with traces enabled.
* The cost is the sidecar’s resources and the span volume (Cloud Trace pricing). Choose the ratio with `traces_sample_ratio`.
### AWS ECS
[Section titled “AWS ECS”](#aws-ecs)
To send to X-Ray, run the **AWS Distro for OpenTelemetry (ADOT) Collector** as a sidecar container in every task. The server has no SigV4 signing; the Collector signs with the task role and sends to X-Ray. The `mycroblog-aws` module of [the OpenTofu deployment](https://github.com/mycroblog/my/blob/main/deploy/opentofu/README.md#sections-of-mycroblog-aws) does all of this by default (`observability.traces = "x-ray"`); the rest of this section is for a task definition of your own.
* Server: `MY_TRACES_EXPORTER=otlp`, `OTEL_EXPORTER_OTLP_TRACES_ENDPOINT=http://127.0.0.1:4318/v1/traces`, and the default `MY_TRACES_FLUSH=batch`, since the process stays up.
* Collector: an image pinned by version, such as `public.ecr.aws/aws-observability/aws-otel-collector:v0.50.0`, with its configuration in the variable `AOT_CONFIG_CONTENT`: an `otlp` receiver over HTTP on `127.0.0.1:4318` and the `awsxray` exporter. X-Ray’s OTLP endpoint (`https://xray..amazonaws.com/v1/traces`, through an `otlphttp` exporter with the `sigv4auth` extension) works too, but needs CloudWatch Transaction Search turned on for the account.
* Grant the task role `xray:PutTraceSegments`, which the `awsxray` exporter writes with. The server samples the traces itself, so the Collector needs no sampling rules from X-Ray.
* Give the Collector a share of the task: `mycroblog-aws` gives it 32 CPU units and 128 MiB, and the server the rest, with `GOMEMLIMIT` at 90% of that rest. Make the server’s container depend on the Collector’s start, so that the Collector stops after the server and receives its last spans.
* The cost is the sidecar’s share of the task’s resources, and the number of traces X-Ray records (the first 100,000 per month are free). The default `traces_sample_ratio` of 0.01 records about 30,000 traces a month for 100,000 requests a day.
## Profiles
[Section titled “Profiles”](#profiles)
The [system metrics](#system-metrics) say how much memory and CPU a process uses; a profile of the Go runtime says what uses it. `pprof_listen` names the address of a listener that serves the profiles under `/debug/pprof/`, for every `role`. It is empty by default, which opens no listener.
```sh
MY_PPROF_LISTEN=127.0.0.1:6060 my serve
go tool pprof -sample_index=inuse_space http://127.0.0.1:6060/debug/pprof/heap # what holds the heap now
go tool pprof -sample_index=alloc_space http://127.0.0.1:6060/debug/pprof/heap # what has allocated since the start
go tool pprof 'http://127.0.0.1:6060/debug/pprof/profile?seconds=30' # where the CPU goes, for 30 seconds
curl 'http://127.0.0.1:6060/debug/pprof/goroutine?debug=1' # every goroutine, by where it waits
curl 'http://127.0.0.1:6060/debug/pprof/heap?debug=1' | grep '^# ' # the runtime's memory statistics
```
The listener has no authentication, a profile shows the internals of the process, and taking one costs CPU: keep it on loopback and reach it through a tunnel (`ssh -L 6060:127.0.0.1:6060 `, `kubectl port-forward`), and unset it when you are done. The heap profile covers the Go heap only. The resident memory of the process also holds the pages of the binary that were read, the stacks, and the runtime’s own structures; the memory statistics give those. The mutex and block profiles are empty: the server does not sample them.
## Stop the server
[Section titled “Stop the server”](#stop-the-server)
On SIGTERM or SIGINT the server shuts down gracefully.
1. It stops accepting new connections and taking jobs.
2. It waits up to 25 seconds for in-flight requests and running jobs to finish.
3. After 25 seconds it cancels the context of the remaining requests and jobs and closes connections. It then gives a cancelled job up to 3 more seconds to record its result, and exits with code 1 (at most 28 seconds in all, within the default 30-second grace period of Kubernetes and ECS). A cancelled job is retried. A job that does not stop within those 3 seconds, or that is killed midway, is abandoned and picked up again by a worker when its lease expires, so it may run twice.
A panic in one of the server’s background tasks starts the same shutdown, so that the server never keeps running in a broken state. The `serve failed` log line names the task, and the process exits with code 1 for the platform or the process manager to restart it.
For work on the database, key-value store or queue, restart in maintenance mode (`MY_MAINTENANCE=true`) instead of stopping. See [Maintenance](/next/operations/maintenance/).
## The job queue and failed (dead) jobs
[Section titled “The job queue and failed (dead) jobs”](#the-job-queue-and-failed-dead-jobs)
[Jobs](/next/reference/jobs/) lists every job type: what it does, what starts it, how it retries, and what running it again does.
The admin jobs page (Administration → Jobs, `/admin/jobs`, permission `manage_jobs`) has three pages:
* **Queue state** (`/admin/jobs`): how many jobs failed, first, with a link to them; the count per state (queued, running, waiting to retry, failed), each leading to the jobs in that state; how long the oldest due job has waited; and a table of the counts per type and state with how long each type keeps a job waiting.
* **Job list** (`/admin/jobs/list`): the jobs that are not finished (queued, running, waiting to retry), or of one state, and of one type, a page at a time, with the type, the number of attempts, the time it is due or failed, the state, and the first line of the last error.
* **A job** (`/admin/jobs/`, from the type in the list): **Run again** for a failed job, which asks first, since a run may repeat what the job did before it failed; every fact of the job, its ID and keys each with a copy button; its last error and its payload, each with a copy button; a table of the unsuccessful attempts, newest first (result, end time, worker, and the error); and a link to the jobs of its type.
The admin API is `GET /api/v1/admin/queue`, `GET /api/v1/admin/jobs?state=&type=`, `GET /api/v1/admin/jobs/{id}`, `GET /api/v1/admin/jobs/{id}/attempts` and `POST /api/v1/admin/jobs/{id}/retry`. A completed job is no longer in the queue, so its page is not found.
* Waiting, running and retry-waiting jobs can be listed only for the queues whose jobs the server holds: `queue = db`, `queue = cloudtasks` (the jobs are in the database too), and `queue = inline`. Failed jobs and the attempt history are in the application database for every queue, so they can always be listed.
* The attempt history keeps only unsuccessful attempts (retries and the attempt that finally failed). Follow a successful run through the structured `job` log line (which carries `job_id`). The history is removed by the hourly cleanup once `job_attempt_retention` (default 30 days; see the [setting](/next/reference/configuration/#job_attempt_retention)) has passed since the attempt ended. The history holds no payload or handler log, and an error message is cut to its first 2,000 bytes. Job handlers keep email addresses, IP addresses, tokens and post bodies out of error messages. For a view limited to email job types, see [Sending email](/next/operations/email/).
A job whose handler decided it failed for good, and a job that used up its retries, becomes a dead job in the database queue (`queue = db` and `queue = cloudtasks`). `my job` lists, retries and deletes them. The “Failed” state of the jobs page and the admin API can also list and retry them.
```sh
my job list # newest failures first: ID, type, run count, time of failure, last error (-limit sets the count, default 50)
my job retry [...] # reset the attempt count and put the job back in the queue to run immediately
my job delete [...] # remove without running
my job types # print every job type of this release
```
* If a job with the same idempotency key is already waiting, that job stands in for the retried one. Job handlers are idempotent, so putting the same job back any number of times is safe.
* An unknown ID is printed and the command exits with code 1; the other IDs are still processed. Exit code 2 means a usage error.
* A dead job that nobody retries is removed by the hourly cleanup once `dead_job_retention` (default 30 days; see the [setting](/next/reference/configuration/#dead_job_retention)) has passed since the failure.
* Dead jobs of `queue = inline` live in the server process’s memory, so `my job` cannot handle them (exit code 1).
### Splitting workers by job type
[Section titled “Splitting workers by job type”](#splitting-workers-by-job-type)
By default every worker runs every job type, in the order the jobs fell due, one job at a time per process (see [Running several jobs at once](#running-several-jobs-at-once)). A burst of deliveries then delays email and notifications, and any worker you add shares its time among all of them. With `queue = db` you can give some types their own workers:
* [`worker_job_types`](/next/reference/configuration/#worker_job_types): this process runs only these types.
* [`worker_job_types_except`](/next/reference/configuration/#worker_job_types_except): this process runs every type but these.
Each is a comma-separated list of [job types](/next/reference/jobs/) (`my job types` prints them; `my config check` refuses a name that matches none), written as a name (`federation.deliver`) or a prefix (`federation.*`). Set them per process, for example with `MY_WORKER_JOB_TYPES`. You cannot set both on one process. A name or prefix that matches no job type stops the start, which also catches a type that a release renamed, or a type that exists only with a setting you have not set. They do not work with `role = web`, or with `queue = cloudtasks` or `inline`, where the start fails too: there a signal names the job to run, so a process cannot choose its jobs.
At the start, a process with one of the settings logs the types it skips. It cannot see the settings of the other processes, so **make sure that some process runs every type**, or those jobs wait forever. Periodic cleanup and email are job types too. Every process still starts the periodic jobs; which process runs them depends on these settings.
Decide what to split from the metrics, not from the type names. `my.job.wait` (Prometheus: `my_job_wait_seconds`) shows how long jobs waited by type before they started:
```promql
histogram_quantile(0.95, sum by (my_job_type, le) (rate(my_job_wait_seconds_bucket[15m])))
```
`sum by (my_job_type) (rate(my_job_duration_seconds_sum[1h]))` shows the worker time each type uses, which is also about how many processes it needs. A type that uses most of the time and makes the others wait is the one to move.
Three common layouts, with the number of processes of your choosing:
| Layout | Processes |
| -------------------------------------------- | ----------------------------------------------------------------------------------------------------------------------------------------------------------------------------------------------------------------------------------------------------------------------------------------------------------------------------------------------------------------------------------------------------------------------------------------------------------------------------------------------------------------------------------------------------------------------------------------------------------------------------------------------------------------------------------------------------------------------------------------------------------------------------------- |
| Keep deliveries from delaying the rest | `worker_job_types = federation.fanout,federation.deliver` for the deliveries, and `worker_job_types_except = federation.fanout,federation.deliver` for everything else. Add processes to the first group during a burst. |
| Keep a search backend from delaying the rest | `worker_job_types = search.*` for the search jobs, and `worker_job_types_except = search.*` for everything else ([Keeping search from delaying other jobs](/next/operations/search/#keeping-search-from-delaying-other-jobs)). |
| Keep email and notifications quick | `worker_job_types = identity.verification_email,identity.password_reset_email,identity.password_notice_email,identity.closure_email,identity.deactivation_email,notification.email,notification.moderator_email,notification.supporter_email,notification.push,notification.post_subscribers,instance.notify_announcement,voice.notify_started` for these, and a worker without a setting for everything, which also helps with these types when it is free. Leave out the types of settings you have not set, or the start stops: `notification.push` needs `vapid_private_key`, and `notification.email`, `notification.moderator_email`, and `notification.supporter_email` need `mail`. See [Jobs that depend on settings](/next/reference/jobs/#jobs-that-depend-on-settings). |
A prefix such as `identity.*` is the code module that owns the types, not a kind of work. `identity.*` also takes data exports, imports, and expiry jobs, and it misses `instance.notify_announcement` and `voice.notify_started`, so a layout for one kind of work names each type.
Keep these together, on workers with the same setting. Jobs of one ordering key run in order whatever their type, so if nothing runs the earlier job, the later one waits too, and if the group of the earlier job is backed up, the later job waits for it:
| Types | What they keep in order |
| ----------------------------------------- | ------------------------------------- |
| `federation.fanout`, `federation.deliver` | The deliveries of a like and its undo |
| `voice.apply_media_event`, `voice.apply` | The events of one voice room |
| `supporters.sync`, `supporters.command` | The changes of one subscription |
When you upgrade:
* A process with `worker_job_types` does not run the types a new version adds. Check the release notes and the skipped types in the log. A process with `worker_job_types_except` runs them, which makes it the safer place for everything else.
* A renamed type stops the start, so read the release notes first.
To roll a split out, start the new workers first, then add the setting to the old ones. To roll it back, remove the setting from one group before you stop the other. Jobs stay in the queue, so nothing is lost, and a type that is run by nobody for a while only waits.
**Detecting a type that nothing runs.** The jobs of such a type wait, so `my.queue.oldest_ready_age` grows for that type, and the alerts `MyQueueBacklog` and `MyQueueStalled` fire on the type that waits longest. To see which one, or to alert per type:
```promql
max by (my_job_type) (my_queue_oldest_ready_age_seconds) > 1800
```
The admin jobs page shows the same wait per type. A worker with one of the settings also leaves alone a job whose type has no handler at all (it counts under `other` in the metric), so with no worker without a setting, such a job waits instead of becoming a dead job.
### Running several jobs at once
[Section titled “Running several jobs at once”](#running-several-jobs-at-once)
[`worker_job_concurrency`](/next/reference/configuration/#worker_job_concurrency) sets how many jobs a process runs at once, from 1 to 128. It works with `queue = db`; with Cloud Tasks the platform decides it. The default is one job at a time, and a setting of 1 behaves the same.
Raise it for jobs that spend their time waiting on other servers, such as `federation.deliver`. Those use little memory and few database connections per job, so one process does the work of many: in a local test where a job only waited 200 ms for a response, one process with 32 slots matched 32 processes with one slot each, using a small part of the memory. Those jobs did nothing else, so measure your own instance. Pair it with `worker_job_types`, and give each kind of job a process with its own number.
Keep these limits in mind:
* **Database connections**: a job needs a connection to be claimed, for its own work, and to record its result. The setting must be below the pool maximum, or the server does not start. The maximum is `pool_max_conns` in `database_url`, by default the greater of 4 and the CPU count, so one vCPU allows 3 until you raise it. Check that your database or connection pooler accepts the connections of all your processes.
* **SQLite**: it writes one transaction at a time, and in a local test it ran slower at 128 than at 32.
* **CPU-heavy jobs**: slots share one process’s CPU and memory. `media.process` waits for its turn at a limit of half the CPUs by default, and the wait counts against the job’s 5-minute lease, so a process full of `media.process` can run past the lease and start over. Give such jobs a process with few slots.
* **One server at a time**: a process makes at most 8 connections to any one host, so one process delivers to a single server no faster than 8 connections allow, however many slots it has. Where most deliveries go to a few large servers, more processes help where more slots do not.
* **A stuck server holds slots**: slots waiting on a slow server are not free for other jobs, so keep deliveries apart from email and notifications.
* **Deploys use attempts**: when the server stops, jobs still running after `ShutdownTimeout` (25 seconds by default) are cancelled, and each cancelled job uses one attempt. The more slots run slow jobs, the more attempts each deploy uses. A cancelled job whose result is not recorded in time waits for its lease to expire before it runs again.
* **A crash takes every slot with it**: if the process runs out of memory, all its jobs wait for their leases to expire.
To decide whether to raise it, read `my.job.wait` per `my.job.type`: if jobs of a type wait for long while `my.job.duration` is mostly time spent waiting on other servers and CPU and memory stay low, more slots should help. If waits stay high after raising it, look at database connections and the host limit above before raising it again.
While no job is due, one slot polls and the others wait, so an idle process costs the database what a one-job process costs.
### Waiting for a database connection
[Section titled “Waiting for a database connection”](#waiting-for-a-database-connection)
With `database = postgres`, every statement and transaction first waits for a free connection of the process’s pool. [`database_acquire_timeout`](/next/reference/configuration/#database_acquire_timeout) (default `60s`) bounds that wait, and nothing else: a long query or transaction that already has its connection runs on, however long it takes. `0` waits without a limit. SQLite has no limit on connections to wait for, so setting it there fails at startup.
When the wait runs out:
* A request is answered `503 Service Unavailable` with `Retry-After: 5`.
* A job runs again 30 seconds later and uses no attempt, so a busy database never turns a job into a dead job.
* The `db.client.connection.timeouts` metric counts it, and the [`MyDBPoolWaiting`](/next/operations/alerts/#mydbpoolwaiting) alert fires.
The default is the server’s 60-second write timeout: a request that waited longer could not send its answer anyway, so the default fails no request that could still have succeeded. Choose a value from how your instance runs:
* **Lower it** to shed load quickly: clients retry after `Retry-After` instead of holding their requests open. Keep it longer than your slowest normal transactions, or a short burst starts answering `503`.
* **Size the pool first.** A process needs about as many connections as it runs work at once. `pool_max_conns` in `database_url` defaults to the larger of 4 and the CPU count, and all processes together must stay under the database’s connection limit.
* With [`worker_job_concurrency`](#running-several-jobs-at-once), slots wait for connections too, and the setting must stay below the pool maximum.
* On Cloud Run, a service takes 80 concurrent requests per instance by default. With a pool of 4, a burst of slow requests queues here, so raise `pool_max_conns`, lower the service’s concurrency, or both.
* **Frequent `503`s or `db.client.connection.timeouts`** mean the pool is too small or queries got slower; a longer timeout only hides that. Follow [`MyDBPoolSaturated`](/next/operations/alerts/#mydbpoolsaturated).
### Cloud Tasks
[Section titled “Cloud Tasks”](#cloud-tasks)
[Deploying on Cloud Run](/next/operations/deploy-cloud-run/) sets up everything below with OpenTofu modules.
With `queue = cloudtasks` the jobs stay in the database (`database = postgres`), and Google Cloud Tasks only wakes the server up for each of them:
* For every job it stores, retries, or puts back, the server creates a task in `queue_cloudtasks_queue` once the transaction commits. The task calls `POST {queue_cloudtasks_url}/_internal/jobs` at the time the job is due, with the job’s ID as its body and an OIDC ID token of `queue_cloudtasks_service_account`. A job due more than 30 days ahead is signaled at 30 days, and again when that task arrives.
* The process that receives the task runs the job and answers `204` once its result is recorded, also when the job already ran or is not due. A job that fails is retried by the server at its next attempt time, not by Cloud Tasks. Cloud Tasks retries a task only when the answer is `5xx` (the database could not be reached) or `401` (a token that the server refused), so its `retryConfig` needs no tuning.
* No process polls the table and no process runs the periodic jobs by itself. Create a Cloud Scheduler job that calls `POST {queue_cloudtasks_url}/_internal/tick` every minute (`* * * * *`) with an OIDC token of the same service account (and the audience of `queue_cloudtasks_audience`, when set). Each tick enqueues the periodic jobs whose period came, once for the whole instance (the periods are claimed in the KV, so `kv` must be `db` or `valkey`), and signals again the jobs that have been due for over 2 minutes without running, which recovers a lost signal.
* `/_internal/jobs` and `/_internal/tick` are served by the processes with `role = all` or `worker`, and accept only a token signed by Google for `queue_cloudtasks_service_account` with a verified email, whose only audience is `queue_cloudtasks_audience` or, by default, the URL called. Any other request is a `401`.
* A delivery runs one job, for at most the 5-minute lease. Keep `queue_cloudtasks_dispatch_deadline` (default 10 minutes) and the request timeout of the Cloud Run service longer than that.
* The server’s own service account needs `roles/cloudtasks.enqueuer` on the queue and `roles/iam.serviceAccountUser` on `queue_cloudtasks_service_account`. It authenticates with Application Default Credentials.
### How late periodic jobs run
[Section titled “How late periodic jobs run”](#how-late-periodic-jobs-run)
A periodic job runs up to one period of its trigger after its time, plus the time the platform takes to start it. This is what decides how late the reminders and start notifications of events arrive and their voice chat rooms open, since `gathering.tick` starts them: a reminder is late by up to the interval in the table. The values are what the scheduler code and each platform’s trigger give; they were not measured on a running server.
| Platform | What starts the periodic jobs | Expected delay of an event reminder or start |
| ---------------------------------------------- | ------------------------------------------------------------------------------------------------------------------------------------------------------------------------- | ------------------------------------------------------------------------------------------------------------------------------------------------------------------------------------ |
| Self-hosting and Docker Compose (`queue = db`) | The scheduler in each process with `role = all` or `worker` checks once a minute, from when the process started, and queues each job once per period for the whole server | Up to 1 minute, plus about a second for a worker to pick the job up |
| AWS ECS Fargate (`queue = db`) | The same scheduler, in the worker tasks | Up to 1 minute, plus about a second |
| Cloud Run (`queue = cloudtasks`) | Cloud Scheduler calls `/_internal/tick` on its schedule, `* * * * *` (every minute) by default; Cloud Tasks then wakes the server for each job | Up to 1 minute, plus the start of an instance when none is running (a cold start, usually a few seconds). With a longer `tick_schedule`, such as `*/10 * * * *`, up to that interval |
| AWS Lambda | `my` has no Lambda deployment; on AWS, run it on ECS Fargate | — |
A reminder that would arrive after its event started is not sent, and neither is a start notification after the event ended. So with a tick longer than 5 minutes, the shortest reminders can be lost.
### Routing job types to their own queues
[Section titled “Routing job types to their own queues”](#routing-job-types-to-their-own-queues)
With `queue = cloudtasks`, a worker cannot choose the jobs it runs: `worker_job_types` works only with `queue = db`, because the platform decides who receives a signal. To give some job types their own capacity, send their signals to their own queue, and set the capacity of that queue on the platform. Nothing changes unless you set a route.
[`queue_cloudtasks_routes`](/next/reference/configuration/#queue_cloudtasks_routes): `federation.*=projects/p/locations/l/queues/my-federation@https://federation-worker.example.com,notification.email=projects/p/locations/l/queues/my-mail`. A route without `@` and a URL calls `queue_cloudtasks_url`.
The left side is a job type from the [job reference](/next/reference/jobs/) or a prefix. A name wins over a prefix, and a longer prefix over a shorter one. Types that match no route, including those a later release adds, use the default queue (`queue_cloudtasks_queue`), so they keep running. `my config check` checks the form of the routes; a left side that matches no job type stops `my serve` at startup.
**Give every process the same routes, `role = web` included.** A signal is sent by the process that stores the job: a web process for most of what users do, such as the first job of a post, and a worker for the jobs that a job stores, retries, the next job of an ordering key, and the sweep of lost signals. Where each role has its own settings, as Cloud Run services do, pass the same value to all of them:
```sh
routes='federation.*=projects/p/locations/l/queues/my-federation@https://federation-worker.example.com'
gcloud run services update my-web --update-env-vars "^|^MY_QUEUE_CLOUDTASKS_ROUTES=$routes"
gcloud run services update my-worker --update-env-vars "^|^MY_QUEUE_CLOUDTASKS_ROUTES=$routes"
gcloud run services update my-federation-worker --update-env-vars "^|^MY_QUEUE_CLOUDTASKS_ROUTES=$routes"
```
A process with other routes raises no error and loses no job: its signals go to another queue, and the jobs run there, outside the capacity you set. `my.queue.oldest_ready_age` does not show this, because those jobs do not wait. To compare the processes, each logs at startup a line with its `routes` and their `routes_hash`: the hash has to be the same everywhere. To see where signals go, read the platform’s own metrics of each queue.
**Permissions.** The credentials of every process need to send to every queue of the routes: `roles/cloudtasks.enqueuer`. A send that fails is logged and not tried on another queue, so that a type you limit does not overflow to the others. Those jobs start late, once the sweep sends their signals again after 2 minutes.
**Capacity.** Any receiver runs any job, so you choose how far to separate them:
| Platform | One receiver | Separate receivers |
| ------------ | ---------------------------------------------------------------------------------------------------------------------------------- | ----------------------------------------------------------------------------------------------------------------------------------------------------- |
| Google Cloud | One service. Each queue has its own `maxConcurrentDispatches` and `maxDispatchesPerSecond`; the service’s instance limit is shared | A service per queue, named by the URL in the route, each with its own instance limit and concurrency. Each sets `queue_cloudtasks_url` to its own URL |
A queue needs the same setup as the default one: the role on the queue. Only the default queue needs the tick.
**What a queue adds.** Each queue is one more thing to create, watch, and pay for, and how much that matters depends on the size of your instance. Split what you have seen waiting in `my.job.wait`, not everything.
**The sweep.** Every minute the sweep looks for jobs that have been due for over 2 minutes without running, up to 500 per route and 500 for the default queue, and signals them again. So a queue that cannot keep up gets up to 500 duplicate signals a minute. They do not run a job twice, but they are messages you pay for, and they stop once the backlog clears.
**Ordering keys** still hold: the database decides what may run. Jobs of one key may be on different queues, but a stalled queue also delays the later jobs of its keys.
**Adding, moving and removing a queue.**
1. Create the queue and its receiver, and give every process permission to send to it.
2. Change the routes on every process. While they differ, signals go to either queue and the jobs run in both places.
3. To remove a queue, take it out of the routes everywhere first, and wait until it is empty before deleting it. A signal in a deleted queue is lost, not its job: the sweep signals the job again once it has been due for 2 minutes. A Cloud Tasks task can hold a signal for a job up to 30 days ahead, so a job due later than the wait is simply signaled by the sweep when its time comes.
## Health checks
[Section titled “Health checks”](#health-checks)
| Path | Kind | When it returns 200 |
| ---------------------------------- | ---------------------------------------------------------------------- | ------------------------------------------------------------------------------------------------------------------------------------ |
| `GET /healthz`, `GET /health/live` | liveness | The process can answer HTTP. It does not look at dependencies such as the database (so a slow database does not restart the process) |
| `GET /readyz`, `GET /health/ready` | readiness | The database is reachable and the schema is applied |
| `GET /api/v1/instance/health` | Uptime monitoring, status pages and clients (served by the `web` role) | The same as readiness. The result is cached in the process for 60 seconds |
* Cloud Run reserves some paths that end in `z`, `/healthz` among them, and answers them itself with a `404`; behind it, call `/health/live` and `/health/ready`, which answer the same.
* A 200 from any of them has the body `{"status":"ok"}`.
* `/readyz` checks the database on every request, and concurrent requests share one check.
* `/api/v1/instance/health` returns 200 and `{"status":"ok","checked_at":""}` when healthy, and 503 and `{"status":"unavailable","checked_at":...}` on failure (`Cache-Control: no-store`). Each process touches the database at most once a minute however often it is monitored or requested, and it looks at neither the access token nor the rate limit. Point uptime monitors at this endpoint, not at the probe (`/readyz` or `/health/ready`). For per-service setup, monitoring interval and cost, and how maintenance is treated, see the [uptime monitoring guide](/next/operations/monitoring/).
* All three log at the Debug level in the access log and create no trace span.
* When readiness is not met, the response is 503 with an RFC 9457 `application/problem+json` body. Its `title` is translated according to `Accept-Language` and contains no internal detail. The cause (a connection error, or the names of missing tables) goes to the log.
* One readiness check is cut off after 3 seconds.
* Readiness also requires that the database holds the configured `host` and `account_domain`, or that the process could record them.
* **Schema applied** means every table that the database’s schema files (`schema/-/.sql`) declare with `CREATE TABLE` exists (SQLite is checked through `sqlite_schema`, PostgreSQL through the connection’s `current_schema()`). `my schema apply` applies the whole schema, so a missing table means the schema is not applied or is older than the binary. Column and index differences are not checked; `my schema apply -dry-run` prints what would change.
## Requests that bypass the CDN
[Section titled “Requests that bypass the CDN”](#requests-that-bypass-the-cdn)
When the server is behind a CDN and its own address stays public, set `origin_secret` and `origin_secret_header` so that it refuses what did not come through the CDN. The health checks stay reachable. See [Refuse requests that did not come through the CDN](/next/operations/cdn/#refuse-requests-that-did-not-come-through-the-cdn).
## Security headers
[Section titled “Security headers”](#security-headers)
Every response carries `Strict-Transport-Security`, `X-Content-Type-Options`, `Referrer-Policy`, `Permissions-Policy`, `Cross-Origin-Opener-Policy`, `Cross-Origin-Resource-Policy: same-site` and `X-Frame-Options`, and, for responses that are not documents, `Content-Security-Policy: default-src 'none'; frame-ancestors 'none'; base-uri 'none'`. A handler overrides these for responses that need other values, such as ActivityPub JSON and public media. `Permissions-Policy` denies the camera, geolocation, payment and USB. It denies the microphone too, except while the voice chat is on (`voice` is not `off`): then it allows the microphone for pages of the server’s own origin only (`microphone=(self)`), so that browsers can speak in a call. The web client’s HTML gets a document CSP that does not use a nonce (`script-src 'self'` and so on). It requires Trusted Types (`require-trusted-types-for 'script'`) and limits the policies that can be created to the client’s two (`trusted-types my-server-sanitized-html my-service-worker`).
## Web client
[Section titled “Web client”](#web-client)
A process whose `role` is `web` or `all` serves the web client embedded in the binary.
| Path | Content | `Cache-Control` |
| ---------------------------------------------------------------------------------------------------- | -------------------------------------------------------------------------------------------------------------------------------------------------------------------------------------------- | ------------------------------------------------------ |
| Any `GET` that no other route matches (`/`, `/@alice`, `/@alice/status/{id}`, `/settings` and so on) | The SPA’s HTML shell. The instance settings are passed in ``
2. Check the HTML of each URL.
```sh
curl -sS -D - -H 'Accept: text/html' https:///@alice/status/
```
* The status is 200 and the meta tags in the table above are there. The `unlisted` post has `noindex`.
* A `private` post and a nonexistent ID give the same 404 body with `X-Robots-Tag: noindex, noarchive` (and `noai, noimageai` too when the settings refuse AI).
```sh
diff <(curl -sS https:///@alice/status/) <(curl -sS https:///@alice/status/0192f3a4-7b1c-7d2e-9f00-1a2b3c4d5e6f)
```
* The `